In case you aren’t one of the three people in the world who read the first post in this series, Is Comcast throttling me?, let me bring you up to speed:
- I work remotely from two locations, one has Fios internet and one has Comcast internet.
- The Comcast internet often experiences issues, and I suspected I was being throttled.
- I wrote a script to collect data and gathered a week of data from each location.
- I analyzed the data via Grafana and SQL.
- I was not being throttled, but Comcast’s service experiences frequent reliability issues.
This post is about how I reached the conclusion in #5 from a technical standpoint, including code snippets.
If you just want the results, jump over to the results post.
Step one: Find a speed test
For this project to work, I needed a simple way to figure out my internet speed. I typically build any personal projects in Python (I love Python), and I quickly came across this package which wraps the speedtest-cli in a Python package. However, the warnings about inconsistency at the bottom of that README got me thinking: I want as few things between me and this data as possible; so I went with the speedtest-cli itself, no wrappers.
Install and test speedtest-cli
Speedtest.net publishes their own cli, exactly what I was looking for! I followed their easy setup instructions:
brew tap teamookla/speedtest
brew update
brew install speedtest
Ok, let’s see what it does:
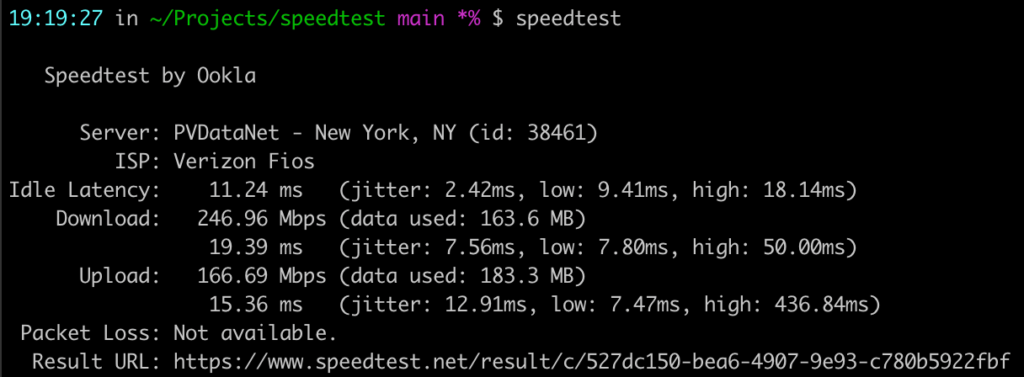
That’s definitely the information I’m looking for, but that output format isn’t very machine-readable. Let’s see what we can do about that. The speedtest-cli doesn’t seem to have any documentation online, but speedtest --help gives lots of helpful info. Specifically, you can pass a format flag e.g. speedtest --format=json, and there’s a line listing out all the valid formats:
Valid output formats: human-readable (default), csv, tsv, json, jsonl, json-prettyJson is always good, let’s see how it looks:
{
    "type": "result",
    "timestamp": "2023-05-06T14:09:21Z",
    "download": {
        "bandwidth": 18202941,
        "bytes": 217569240,
        "elapsed": 12902,
        "latency": {
            "iqm": 14.172,
            "low": 6.099,
            "high": 36.360,
            "jitter": 5.110
        }
    },
    "upload": {
    	...
    },
    ...
}
The speed test returns a lot of information, including a url with a link to the results of that exact speedtest run, which is a nice touch. According to the url, my download was 145.62 Mbps and my upload was 169.67 Mbps. Nothing in the returned data has those values, but there are pieces of data labeled download.bandwidth and upload.bandwidth which seem promising:
- download bandwidth:
18202941 - upload bandwidth:
21208853
There are also keys in the results for download.bytes and upload.bytes, indicating the total volume of data this test used. So my hunch was that those bandwidth numbers are byte values. Some quick googling for convert bytes to megabits says the conversion is 8e-6, otherwise known as 0.000008.
- download =
18202941 * .000008 = 145.62 Mbps - upload =
21208853 * .000008 = 169.67 Mbps
Bingo. Those are exactly the values in the results above.
Step two: create a script, and run it on a schedule
Now that data collection is figured out, I need to do it on a schedule; I settled on every 5 minutes. My very-scientific plan was to start the script every day before I start work and kill it each night around 8pm, so it’ll gather 11-12 hours of data each day.
I initially started this script in Python, using subprocess to execute the command line command, but speedtest returns timestamps as zulu-formatted ISO strings. In other words, it uses dates like this: 2023-04-12T22:31:48.000Z. Normally that’s wonderful and I love it, but Python doesn’t like the Z, so I switched over to using node, which has excellent native support1 for date strings like this.
In plain English, this script needs to do these things:
- Run the speedtest command
- Parse the results, pulling out the things I care about (or I think I might care about in the future)
- Save the results
- Do it every 5 minutes
1. Run the speedtest command
In node, you can run command-line commands via child_process.exec:
const { exec } = require("child_process");

exec("speedtest --format=json", (err, stdout, stderr) => {
    if (err) {
        console.log("Command Failure: ", err);
        return;
    }

    if (stderr) {
        console.log("speedtest had an issue: ", stderr);
        return;
    }

    console.log("The results: ", stdout);
});
2. Parse the results, pulling out the things I care about (or might care about)
Ok, so what do I actually want to save?
- Download speed – the whole point of this project
- Upload speed – also part of the point
- Timestamp
- Time of day in human-readable hours and minutes, to help myself when querying
- Day of the week
- Packet loss percentage – could be interesting
- The ISP providing the service – I can compare Comcast at my in-laws’ to Fios at my place
- The server which handled the test – could be interesting
- The server’s location – also could be interesting
- The url of the test run – for possible future sanity checking
In code:
const BYTE_TO_MBIT = .000008;

// Map date.getDay() index to actual day of week
const DAY_MAP = [
    "Sunday",
    "Monday",
    "Tuesday",
    "Wednesday",
    "Thursday",
    "Friday",
    "Saturday",
];

// The below code all belongs inside the `exec` callback from step 1 above
const result = JSON.parse(stdout);
const timeStamp = new Date(result.timestamp);
const hoursMinutesSeconds = `${timeStamp.getHours()}:${timeStamp.getMinutes()}:${timeStamp.getSeconds()}`;
const downloadSpeed = result.download.bandwidth * BYTE_TO_MBIT;
const uploadSpeed = result.upload.bandwidth * BYTE_TO_MBIT;

const dataToSave = [
    timeStamp.toISOString(), // timestamp
    DAY_MAP[timeStamp.getDay()], // day of week
    hoursMinutesSeconds, // HH:MM:SS
    downloadSpeed.toFixed(2), // download speed in Mbits
    uploadSpeed.toFixed(2), // upload speed in Mbits
    result.packetLoss, // packet loss
    result.isp, // ISP
    result.server.host, // server host
    result.server.location.replace(",", ""), // location of server
    result.result.url, // link to speedtest result
];
3. Save the results
I considered appending the results to a CSV with each run, but assuming the script runs every 5 minutes, 12 hours a day, for 10 total days (5 days per location), I’ll end up with approximately 1440 data points (it was actually closer to 1800). That’s not a big CSV by any means, but it would be nice to be able to query it via SQL.
Instead, I created a table in my local postgres instance:
--- This is the exact structure of my results table
CREATE TABLE IF NOT EXISTS results (
    id SERIAL NOT NULL PRIMARY KEY,
    timestamp TIMESTAMP NOT NULL UNIQUE,
    day_of_week VARCHAR(9) NOT NULL,
    time VARCHAR(8) NOT NULL,
    download_mbps FLOAT NOT NULL,
    upload_mbps FLOAT NOT NULL,
    packet_loss FLOAT,
    isp VARCHAR(50),
    server_host VARCHAR(100),
    server_location VARCHAR(100),
    share_url VARCHAR(100)
);
3b. Connect node script to the database
I used node-postgres, which was surprisingly easy:
// This is the full contents of my db.js file
const dotenv = require("dotenv");
const { Client } = require("pg");

dotenv.config();

// The query to write results
const sql = `INSERT INTO results (
    timestamp,
    day_of_week,time,
    download_mbps,
    upload_mbps,
    packet_loss,
    isp,
    server_host,
    server_location,
    share_url
) VALUES ($1, $2, $3, $4, $5, $6, $7, $8, $9, $10) RETURNING *`;

const writeValues = async (values) => {
    try {
        const client = new Client({
            user: process.env.DB_USER,
            host: process.env.DB_HOST,
            database: process.env.DB_NAME,
            port: process.env.DB_PORT
        });

        await client.connect()
        await client.query(sql, values);
        await client.end()
    } catch (error) {
        console.log(error)
    }
};

module.exports = { writeValues };
4. Do it every 5 minutes
All that’s left is a trusty javascript setInterval(everythingAbove, 300000).
For posterity, here’s the entire script that ran this code over the two week period:
const { exec } = require('child_process');
const { writeValues } = require('./db');

const BYTE_TO_MBIT = .000008;

// Map getDay() index to actual day of week
const DAY_MAP = [
    "Sunday",
    "Monday",
    "Tuesday",
    "Wednesday",
    "Thursday",
    "Friday",
    "Saturday",
];

const hoursMinutesSeconds = (dateObj) =>
    `${dateObj.getHours()}:${dateObj.getMinutes()}:${dateObj.getSeconds()}`;

const runSpeedtest = () => {
    const now = new Date();

    // use stdout so the success log is on the same line as the running log
    process.stdout.write(`Running: ${now.toLocaleString()}`);

    // run the speedtest command line command
    exec('speedtest --format=json', (err, stdout, stderr) => {
        if (err) {
            console.log("Command Failure:");
            console.log(err);
            const dataToSave = [
                now.toISOString(), DAY_MAP[now.getDay()], hoursMinutesSeconds(now), 0, 0, 0, "{ISP changes based on location}", "error", "error", "error",
            ];
            writeValues(dataToSave);
            return;
        }

        if (stderr) {
            console.log("error running command: ", stderr);
            const dataToSave = [
                now.toISOString(), DAY_MAP[now.getDay()], hoursMinutesSeconds(now), 0, 0, 0, "{ISP changes based on location}", "error", "error", "error",
            ];
            writeValues(dataToSave);
            return;
        }

        const result = JSON.parse(stdout);
        const timeStamp = new Date(result.timestamp);
        const downloadSpeed = result.download.bandwidth * BYTE_TO_MBIT;
        const uploadSpeed = result.upload.bandwidth * BYTE_TO_MBIT;

        const dataToSave = [
            timeStamp.toISOString(), // timestamp
            DAY_MAP[timeStamp.getDay()], // day of week
            hoursMinutesSeconds(timeStamp), // HH:MM:SS
            downloadSpeed.toFixed(2), // download speed in Mbits
            uploadSpeed.toFixed(2), // upload speed in Mbits
            result.packetLoss?.toFixed(2), // packet loss
            result.isp, // ISP
            result.server.host, // server host
            result.server.location.replace(",", ""), // location of server
            result.result.url, // link to speedtest result
        ];

        writeValues(dataToSave);
        process.stdout.write(" - Done\n");
    });
};

// Run on start
runSpeedtest();

// And then run every 5 minutes
setInterval(runSpeedtest, 300000);
It’s not the nicest code, but it gets the job done.
Step three: Visualize the results
I used Grafana for visualization, it’s an open-source tool which specializes in analyzing time-series data. I won’t go through how to install and set up Grafana here, their docs are pretty good. Once it was set up and connected to my database, it was very easy to generate graphs like this one:
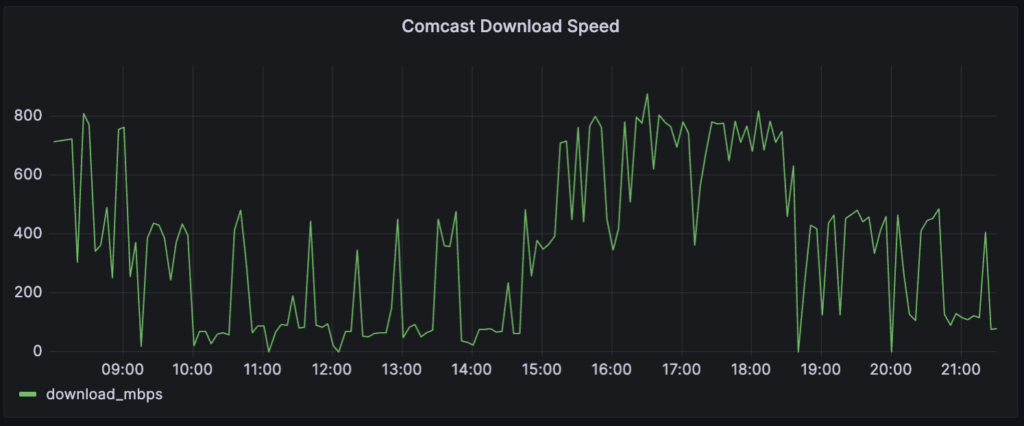
This is the full query powering the above graph:
SELECT "timestamp", download_mbps FROM results WHERE isp = 'Comcast Cable';Grafana also offers a ton of other visualization options:
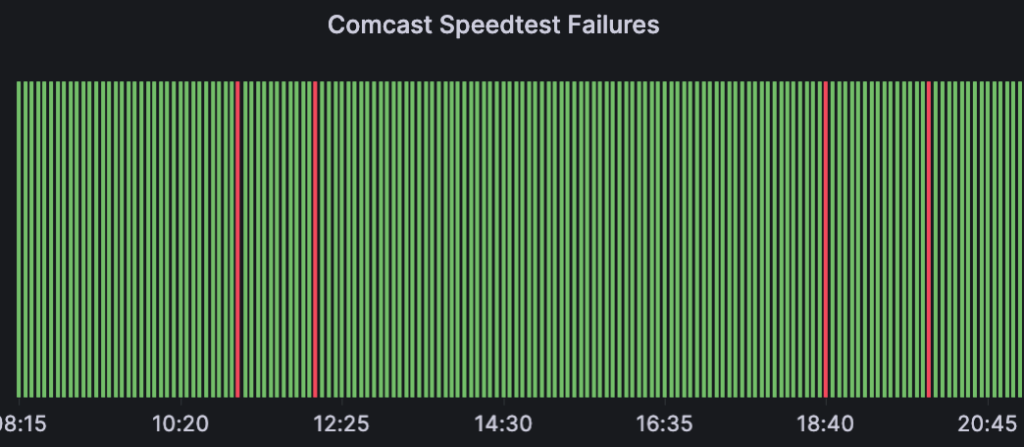
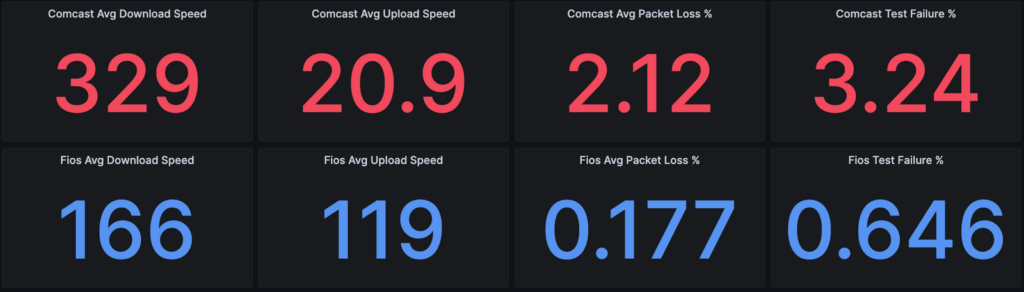
This was my first experience using Grafana, and I can see why it’s so popular. All of these visuals are powered by simple SQL queries, and once they’re set up there’s nothing left to do but wait for more data; the graphs/metrics keep updating.
Final step: Analyze the results
For the final results, head over to the results post!
Notes
- I know. Javascript? Dates? Excellent? Yes. For reading, writing, converting timezones, calculating differences, Javascript is now pretty darned good. ↩︎